 You can be the best thing that has happened to the mankind since sliced bread, but if you don’t have proper skills to make sense of the data you might as well be a potato sitting on your boss’s chair.
(Don’t you love it when someone strings random analogies together and yet it sounds logical?)
With the explosion of data capture technologies and focus on data-driven decision making, I often hear young professionals complaining of “too much data” and getting lost in the gigabytes upon gigabytes of ones and zeroes without truly being able to deliver insights from them.
In this series of articles, we’ll learn supply chain modeling for different types of supply chain problems. We’ll also learn how to present the data in a way it makes the most sense. And based on extensive experience with scores of the clients across the globe, I can safely state that this skill can easily catapult you in top 5% of supply chain professionals who just don’t solve problems reactively but solve them even before they become one.
Before we delve into specific situation-specific models and visualization for supply chain, let us take a moment to understand some basic principles of supply chain modeling. Spreadsheet models and cranky bosses have a tendency to go out of hand pretty soon, and messy excel sheets can only exacerbate the situation. These basic tips and approaches will go a long way in keeping your thought process structured and your bosses calm.
First, let us start with a hypothetical supply chain problem and following it through.
Long time ago in a galaxy far, far away...you worked for an organization that manufactures lightsabers, walkers, droids and other necessary stuff for the Galactic Empire.
Your boss, who works under someone who works under someone who works under Darth Vader himself, has tasked you with calculating the warehousing space the Empire would need in five years time. It’s now up to you, dear SCD, to find the answers the dark lord seeks to help him defeat the rebel forces.
Your heart stops beating for a second as you hear your boss give you this hopelessly daunting task. Not only you know next to nothing about organization’s growth plans, the sheer number of variables makes your head spin. You take a deep breath and stare at the blank excel sheet staring back at you.
Step 1: Clearly identify the objective of your model
Shut-down the lid of your laptop and first pick-up a pen and paper. Close your eyes and reflect for a moment what is really asked of you. Now write it down. You write the following:
Objective: To assess the warehousing space needed by your organization for the next 5 years
Now look long and hard at the objective you have written. Is this complete? Will your boss be happy with this output or he is looking for something more that he doesn’t know yet?
Aha! You strike-out what you had written and re-write the objective -
Objective: To assess the warehousing space needed by your organization for the next 5 years
Objective: To assess the warehousing space needed by your organization by region for the next 5 years
If you don’t get the objective right, chances are that you would be answering the wrong question all the while. Secondly, stating the objective clearly now saves a lot of re-work later. For e.g. had you just given your boss country level warehousing numbers, the immediate next question would be – “Well, how much of that is in the north?” and you’d have to come back to square one because you never thought to get that additional info in your model.
Step 2: Identify key inputs
Don’t open that distracting laptop yet. Next key step is to think through all inputs that you’d need to achieve your objective in step 1. Don’t worry about how or where you’ll get the data or information yet. Just think.
You sigh as your head fills with protesting voices. “This is so hopeless...how am I going to achieve this objective...I mean I don’t even know how much we are going to sell in 5 years...Aha!
You get that first item on your list of inputs:
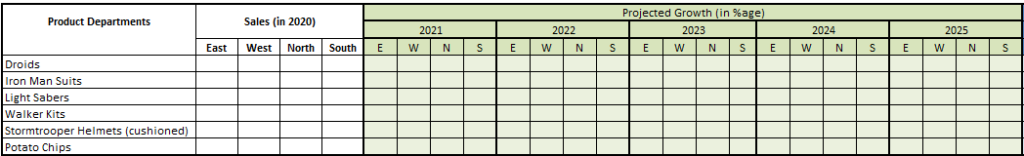
1. Five-year forecast by region
B...But...there are several departments and all of them have different growth plans. Perhaps I need to approach them individually for their forecasts.Hmmm.
1. Five-year forecast by region and department
You take the logic further:
If I knew how many boxes each of the departments will sell and then multiply that by area each of the boxes will occupy...
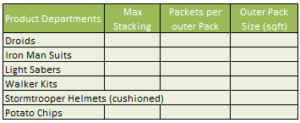
2.Product Master including packaging sizes
Very Soon, by following your logic till the end, you arrive at this list:
1. Five-year forecast by region and department
2. Product Master including packaging sizes
3. No of items that come in a box
4. Stacking norms by the product
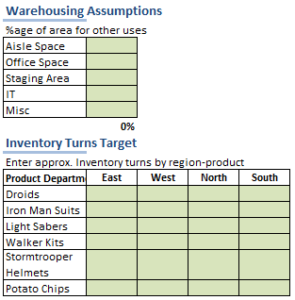
5. Inventory turns by product (by region?)
6. Other space requirements in the warehouse (e.g. aisle space)
Again - don’t worry too much if you don’t list each and every one of the inputs. When you start modeling, you’ll notice your requirements more closely.
Step 3: Build Input Sheets
Alright, open your laptop now. Answer those umpteen messages and mails; we’ll wait right here. Done? Good. Now open a blank excel sheet and create few tabs for the inputs. It’s a good idea to group similar inputs together in one tab.
Download the file here.
Put some dummy data in the blanks just so that you get the number formatting right and you’ll get some sensible values when you put some formulas in there.
We’ll a have separate post on these little tips and tricks of modeling.
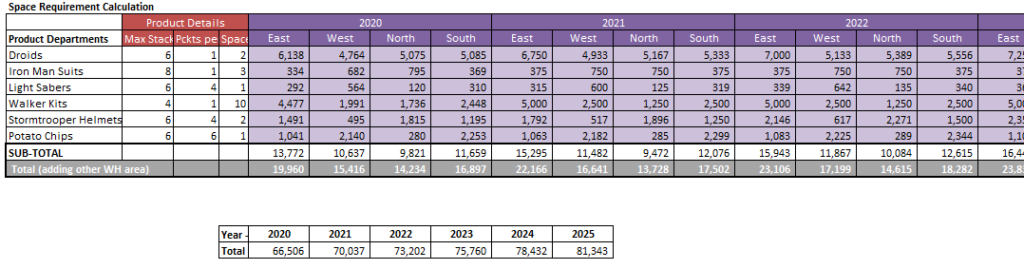
Step 4: Create an output sheet and put formulas
It’s always better to create a separate output sheet. That way you can keep your calculations and data processing separated from your data. If there are multiple steps in the output, create intermediate output sheets too. Since, our warehousing problem in relatively simple, we’ll just have one.
And now the most difficult part – put formulas in your output sheet that can combine all the inputs together. Few tips:
1.Don’t be scared to create multiple tabs or multiple tables in your output tab if there are multiple steps involved.
2.You may also need to restructure your tables to see which one is most efficient with the formula. g. Should I put years in rows or columns? Will it create problems for me while dragging the formula across?
3.Create formulas and voila! You have your 5-year projection of warehousing space by the region.
Download the file with the output here.
Step 5: Present the data
If you showed this output to your boss, he’ll stare at the heap of numbers that you have calculated, might pretend to understand it and forget all about it till the last possible moment.
Your numbers are, of course, correct, but they don’t tell a story. There are no insights from the numbers you have churned so meticulously. Not only your boss but any of the stakeholders will require you to sit with them to explain these numbers. Your work should be able to stand on its own and shouldn’t need a theoretical physicist to understand it.
That’s where data visualization and dashboarding comes into the picture. It takes the data that only you understand and converts it into a super powerful decision enabling tool for EVERYONE. Don’t believe us? Here is the same data presented in a better way.
Download the file with the Dashboard here. (You may be prompted to enable editing in order to use the sliders and check-boxes on the dashboard.)
This tells a story – on the left-hand side map, you can clearly visualize year on year increment of warehousing area by region along with current capacities, on the right-hand side you see the breakdown of area requirement by the department. You can even custom select the departments for easy comparison. To top it off, in the middle, we have the basic information about overall area required in a cool slot machine animation.
And that is not it. For even more inquisitive and demanding bosses, who want to tweak some inputs (c’mon SCD, we will improve on our inventory turns next year), there are hyperlinks to the relevant sheets at the bottom-right where they can tweak the inputs and the dashboard will be updated automatically.
We will have a separate article on dashboarding; meanwhile go ahead and play with the warehousing model that you have created from scratch in 5 easy steps.
This is bound to get your boss’s eyes widened and get your name resounding in the mighty boardrooms and corner offices. Welcome to the club, SCD.