Our previous article on Simulation, unexpectedly, became the most popular post on this blog. Thanks for your love, fellow SCDs.
We also received several e-mails on the topic and they can be broadly classified into two groups.
One group’s feedback went something like –
“I loved your post on simulation. However, I wonder if simulation can only be used for “what-if” analysis or there are other applications too. Nevertheless - a big fan of your work. Hugs and kisses.” (partially exaggerated)
While the other set of responses were less flattering –
“What a load of BS! In what world the customer demand is non-random with a forecast accuracy is 100%. This SCD guy should shut down his website and get a taste of this cruel world. Eat dirt, you phony.” (partially censored)
And to both kinds of people, my simple two-word answer is – MONTE CARLO SIMULATION.
What is Monte Carlo Simulation?
Monte Carlo Simulation is a simple yet brilliant technique where results from several thousand iterations are aggregated to arrive at the solution to an otherwise difficult problem. A common theme of Monte Carlo Simulation is that the input uses random variables. It has been used from simple probability problems to simulations for Manhattan Project.
We can fill pages of theory on Monte Carlo but, as you know by now, here at SCD, we love learning by examples. Today we’ll do three Monte Carlo Simulations and if you understand the logic carefully, you’re guaranteed to achieve the reverence in your professional circles. But don’t get intimidated, we’ll start with super basic ones.
Example 1: Finding probability of getting “7” in random roll of two dice
Example 2: Calculating the value of π
Example 3: Finding the required Safety stock for a target service level
Example 1: Probability of a sum from two-dice roll
 Let us start with a very simple example– we have two sets of standard six-sided die with us. We would like to know what are the chances of getting a total of “7” when we roll them. You can get seven by several possible combinations, say, by getting “5” on one die and “2” on other, “6” on one die and “1” on other. In fact, there are more ways to get “7” than, say, getting “2” which can only be achieved in one way - by rolling “1” on both the dice. So intuitively we know that chances of “7” is higher than “2”, we don’t want to do any mathematics to arrive at the probability. How then, in the name of Fermat, can we calculate it?
Ummmmm... we can roll the two dice a large number, say, fifty-thousand, times and count how many times we get “7”. Well, that’s what is Monte Carlo simulation.
Using MS Excel and its nifty RAND() function, we imitated throwing of two dice fifty thousand times and plotted all the values in a nice Frequency Table.

As you can see “7” occurred a total of 8353 times out of 50,000 tosses. That is 16.71%.
Now, your mathematician friend (what, you don’t have one? Get one. Those are good to keep around in case you are planning to visit some casinos) will tell you that probability of getting “7” from two-dice throw is 1/6, which is 16.67%.
Our simulation gave a very close answer without knowing an iota of probability theory. This is the real power of Monte Carlo simulations. You can download the file and see it for yourself by re-running the simulation by pressing F9. You can also achieve even more accurate answer by increasing the number of rolls.
Example 2: Find π (by throwing darts)
You read that correct. Monte Carlo simulation can be used to calculate nature’s little irrationality by one of the most simple yet brilliant simulation this SCD has ever seen.
Imagine you have a square dartboard. Now inscribe a quarter circle on the dart board such that, the radius of the circle is same as the side of the square. Let me draw it for you.

Now, what is the ratio of two orange shaded area (circle) and the square? Easy-Peasy. 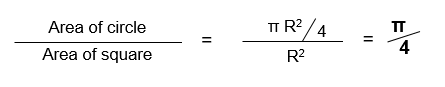
With us till now? Good.
Now, let’s have a little friendly game of darts using that square board. Don’t think too much...just take out a bagful of darts and start throwing. Bam! That’s what I am talking about.

But don’t stop just now...you have to throw 10,000 such darts at the board. Being a lousy thrower you are, darts have landed across the board randomly either inside or outside the circle.
Now you know that larger the area, larger are the chances of dart landing inside. In fact, if you throw large enough number of darts, the fraction of total darts landing inside the circle is equal to their corresponding areas. And we know already that the ratio of areas is equal to π/4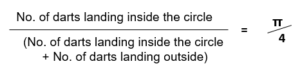
Using the above formula and little magic of excel, we can calculate the value of pi.
See the results of simulation below.
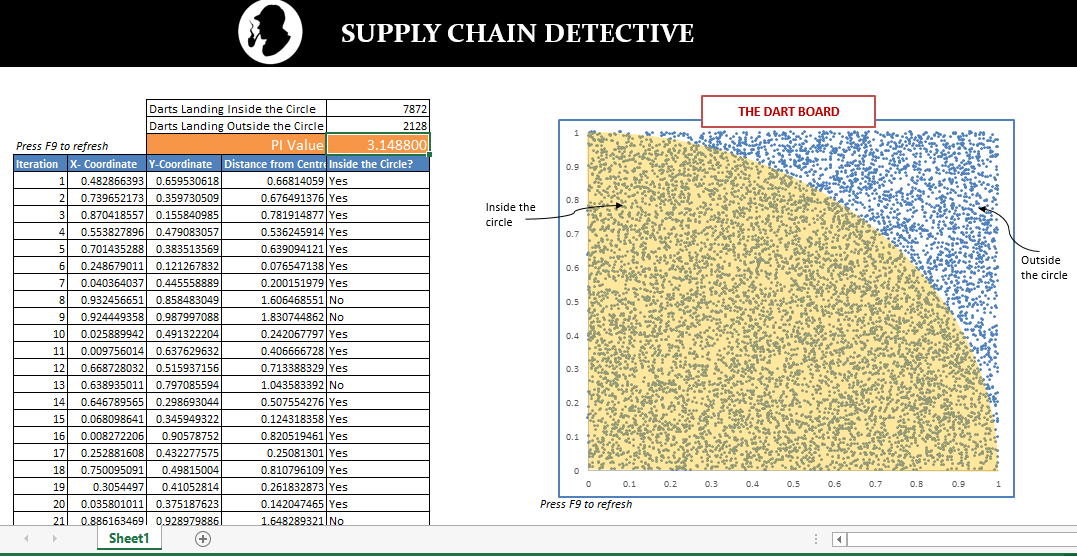
Download the file and feel free to play with it. As you can see, the pi values are in the ball-park. However, you can improve it’s accuracy by increasing the number of “darts” in your simulation.
Example 3: Safety Stock Optimization
We’ve saved best for last. Have you ever been in a situation when you solve a complex business problem (any business problem) by digging into tons of research papers, highly referred books, and top cited material, only to be scoffed at your results by the decision makers just because they don’t understand it? If you haven’t, you WILL be.
This SCD was delivering an Inventory Optimization project for a client when he applied some advanced safety stock calculation formulae to generate inventory recommendations. An unconvinced stakeholder looked at the long list of Store-wise, SKU-wise, inventory recommendations and said –
“What is this mumbo-jumbo with µ’s and sigmas? And are you suggesting that we keep twice the inventory than our average forecast? Are you crazy or what? We will just keep 7 days of inventory as we always have and that’s it. Period.”
How can you convince this guy?
Of course, Monte Carlo Simulation. This SCD created a simulation to show how the customer demand is distributed and how he needed that amount of safety stock to meet the customer service levels – WITHOUT USING A FORMULA. We’ll take you through the step-by-step process on how this is done.
Download the file to follow the next steps.
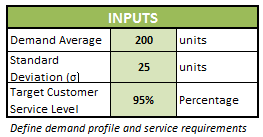
1. Define inputs
Assuming that demand follows a normal distribution, we need the following values as input – Average demand, Standard Deviation of Demand and Target Customer Service Level.
 2.Simulate the random demand
We want to have a randomly distributed demand following the normal curve. Excel functions of Norm.Inv() and Rand(), can help us generate these random demand points. You can refer to the attached excel sheet for the exact formula.
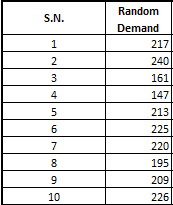
This demand pattern is something we want to show to our beloved stakeholder because they can easily relate to it without going into the formulas. We have generated 10,000 such random demand points and also plotted them on a Frequency Chart.
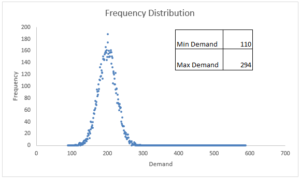
As you can see in the graph above, the most frequently occurring demand is around the average i.e. 200 units. Secondly, as we move further away from the average on either side, the frequency of demand point reduces – this is, in fact, a typical normal curve.
3.Calculate ‘Find’ Safety Stock
The beauty of Monte Carlo Simulation is that we don’t have to calculate anything. We have a long list of possible demands. We also know that we want to fulfill 95% (customer service level) of all those possible demands.
We can sort those 10,000 demand values in ascending order and select the 95th percentile from the top. Thankfully we have a ready-made formula in excel called PERCENTILE.EXC to find that value. And Voila! This is our total inventory requirement.
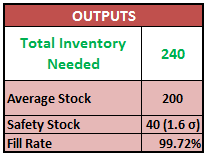
So, 95th percentile value corresponds to 240 units of stock. Out of this average demand is 200 units, and remaining 40 units is safety stock. Corresponding fill rate is 99.72%.
The logical flow in this spreadsheet is far easier to explain to anyone. Show a list of randomly generated demands. Ask how many of those demands organization wishes to fulfill and POP! That’s the stock you need.
Download the file if you haven’t already. Go ahead – all the values are dynamic so have fun playing with it.
BONUS CONTENT!
We can’t give enough. Can we?
We just found out stock levels for a given customer service level. What if we were to flip this problem? What if we were to find the customer service level that can be achieved for a given inventory level? Something that can get us following output.
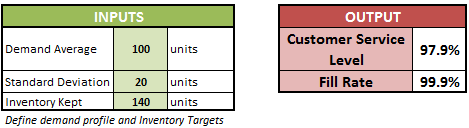
Try making a Monte Carlo model yourself OR download the simulation and analyze the solution. Enjoy!
Did you like this post? What are the other problems where you think you can apply Monte Carlo technique? Let us know through your comments.
I didn’t understand how did you get the fill rate of 99.72%. Could you explain?
Hi Sai,
Good question. Fill rate is that fraction of customer demand that could be met, even if there isn’t sufficient inventory to serve all the demand. In such cases, Customer Service Level (CSL) will register a “miss” but fill rate will show a positive value. For e.g. consider demands on two independent instances to be 40 and 60 respectively. If the inventory level is fixed at 50 units than the first demand could be met but second could not (short by 10 units). In this example, then, CSL will be 50% (1 demand served of two) but Fill rate will be 90% (90 units demand filled against the total demand of 100). There will be a detailed post soon on calculation of some of these KPIs. Hope this clarifies.
Hi, Thank you for sharing this with us. I have a question If we want to apply the MCS for a (R,s) policy should we generate the NORM.INV(RAND(),Average_Demand*(R+L), (NORM.S.INV(CSL)* Std_Dev SQR(R+L)),0) or should we leave it like the way you did, and then the Base stock should be calculted like this:
-Safity stock= NORM.S.INV(CSL)* Std_Dev SQR(R+L)
-Base stock = AVG.Demand *(R+L) + NORM.S.INV(CSL)* Std_Dev SQR(R+L)
Could you help me please?
Thank you!!
Hi! I really enjoyed this. I’m a data science major and for my senior project I want to apply something like this and focus on Supply Chain. Do you have any other resources that I can use to learn about how supply chain uses statistics? Anything will help. Thanks again for this post
Like!! I blog quite often and I genuinely thank you for your information. The article has truly peaked my interest.
Am trying to solve the same problem. But isn’t lead time an important factor to consider while calculating safety stock? how to incorporate lead time factor in this solution?