Welcome back SCD!
I believe you are still basking in glory after creating an awesome warehouse requirement model much to the pleasure of your boss. But you know what, we are just getting started– and you’ll soon find yourself encountering much more complicated problems. But don’t you worry; the five-step process that you learned in previous article, remains valid for all complexities and scales.
 In this post, we’ll be looking at some tips and tricks that will improve your model structure and polish rough edges in your model. Individually, these seem like minor tidbits but sooner you inculcate these “hacks” as part of your day-to-day work, sooner you’ll realize that your thought process has become much more structured and your output significantly better than your colleagues. With some practice, before you know it, you will be that rare person in your organization who can translate seemingly insurmountable data into brilliant insights.
1. Color code your tabs and fields
Color coding your tabs and fields provide an instant visual cue to anyone looking at your model. In our previous model, we had input tabs as well as input fields colored in green.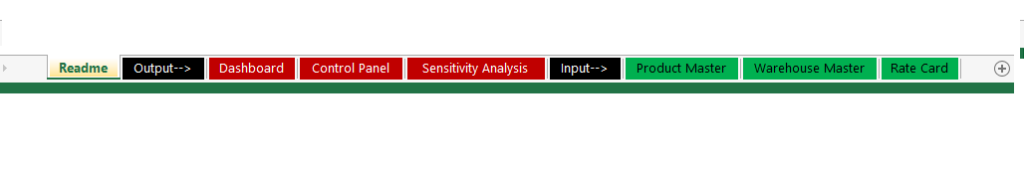
2. Use “Name Boxes” to name your variables
This is one of the most useful functionality that most people either don’t know about or simply don’t pay enough attention to. You can name your important variables with meaningful names like “Pi”, “TruckingCost”, “TargetGrowth” etc. and then you can simply use this name in your formulas rather than referencing the cell where it is stored.
This name can be used anywhere in the workbook making your formulas easier to understand and also reduces chances of an error or wrong referencing.
3. Segregate input, output, and working sheets
If needed, you can add segregation sheets between various tabs of your model.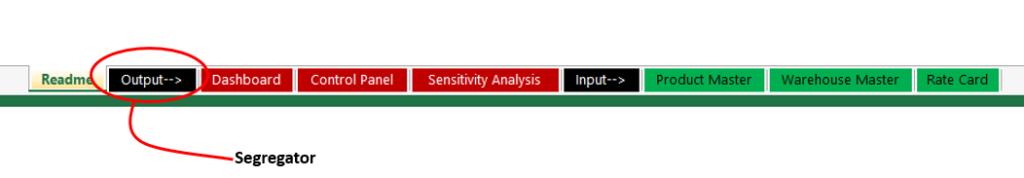
That way you can find all the related tabs and one place and keeps things structured.
4. Never hard code important inputs
If there is one thing that prevents your model being used by wider audience is lack of flexibility to change important inputs. There will always, I repeat always, be some inputs that are prone to changes. For e.g. in our WH model, though the departments gave you one single number for growth, no one would be sure if the growth will be 5% or 10% or 20%.
Don’t hard code such numbers and put such inputs as variables, preferably somewhere near the result tab where you can easily change them and see the results.
Another example could be currency exchange rates - you may be tempted to directly convert the currencies inside a formula itself, but taking time and effort to make it a variable pays off in such cases, since you don’t know when you’d need to change these variables or when your model will be used.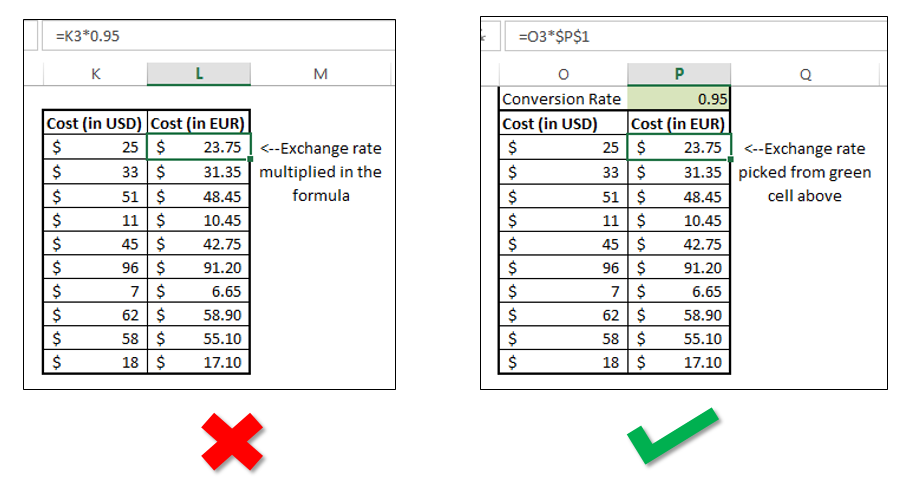
When you variabalize important inputs, you can be rest assured that your model can be used by the organization for years to come.
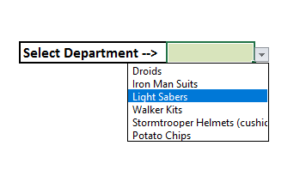
5. Use data validation functionality
This is another functionality that is often overlooked by most users. Data validation is a very useful while getting user inputs. You can have a drop-down list where the user can choose a relevant value. You can also have message pop-ups if the user enters invalid values.
6. Provide a readme tab
If you expect your model to be reused by a large number of people across the organization (In fact, you should aim for it), add a readme sheet in the beginning, explaining what model is doing and how a user can go about using it. You can also use this space to document all your assumptions.
Lastly, do provide your contact information so that they can approach you in case they identify bugs or have any suggestions or simply want to say thanks. It’s also a great way to get your name on your work.
7. Clear the clutter
You can make your sheets, especially the dashboards and output files look cleaner by
a. Hiding gridlines, headers, formulas and ribbon
b. Hide additional rows/columns
c. Hide working sheets that are not relevant to the audience
It also gives you more visual space and reduces the possibility to users unnecessarily poking in your working sheets.
8. Present your data in a form that is most useful to the audience
Understand your audience first and present your output accordingly. In fact, everything in your output dashboard should reflect the needs of that audience. For e.g. let’s assume you are presenting vehicle utilization data. If your audience is 3PLs representatives, then you want to show it to them by vehicle type and transporter. However, if the audience is the CEO, you want to show it by region along with competitor’s numbers.
Ask yourself a few questions beforehand:
a. What is the most important information for that stakeholder?
b. What are his/her KPIs?
c. Where do you want his decisions to be focused?
d. Who are the other people in the room? What questions can they raise in the room?
Additionally, if you aren’t confident of certain input parameters, you should keep those parameters along-side the output so that it can be changed “live”.
9. Stress test your sheets
Whenever you are giving a live demo, there will be at least one over-enthusiastic participant who’d want to solve global poverty through your excel sheet. Especially, if you’ve provided many user controlled inputs, some people will invariably be tempted to move the dials to 11.
Mr. SCD, what would happen we move that growth rate to be 100% and cost reduction targets to be aggressive 40% and ...
When you give them a hammer, everything will look like a nail. Your job is to either
a. Not give them more powerful hammer than needed. (Restrict user inputs to a certain range. For e.g. in the warehouse space calculation sheet, the slider can only be used to select years between 2020 and 2025) OR
b. Have your nails ultra solid. (You test your outputs to see that nothing breaks for extreme input values)
There is a highly discouraged third option too. Don’t even consider it! 1
10. Be ultra careful with external work-book references
Quite often, the model perfectly works on your system but when you send the file out, people begin to complain about ugly error message smeared all your hard work. This happens when writing your formulas, you referenced another file on the system. These formulas are unable to calculate as it can’t find that data at the other local machines and throw up an error.
For such cases, consider making those datasets as part of your model.
Even otherwise, especially for super-high level presentations, it’s a good idea to test it beforehand from other machines.
11. Validate formula after every step
I’ve noticed some people treating excel modeling similar to writing a story – they want to finish it first and then do the “spell check “later. BIG mistake. Large models have several logical steps working in tandem and in the case of errors, tracing back the mistakes across sheets could be a nightmare. Even worse, you may not see anything weird in your final output and mistakes may remain under the radar untill its too late.
So, cross check your formula results, manually tally couple of your vlookups, glance at the quick sums and counts at the bottom right of the sheet before going to the next step.
Additionally, formula auditing (esp formula evaluation) functionalities of excel can be quite handy to check your formula logic.
One extra minute spent in validation can save you hours of debugging later.
12. Disable auto-calculation
Every time you change even the slightest thing on your excel sheet, everything in your workbook re-calculates. If your workbook is large and formula heavy, each such change makes your workbook refresh for several seconds. When your workbook reaches such size, disable auto-calculation of the workbook to make it faster. Don’t forget to refresh it manually (F9) when you want to see updated results.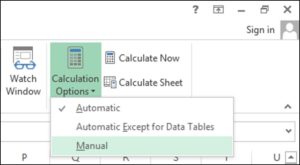
13. Data Management
This last tip is perhaps THE most important one. You can build a Ferrari of an excel model but it’d be utterly useless if you don’t have a quality raw data to fuel it. Hence, one of the first things that one should check before embarking on modeling, is data availability and data quality.
13a. Check for data availability
Having data vs no data can make the difference between
a. Looking for a black needle. In a black haystack. On a moonless night. Blindfolded. Hand tied.
vs
b. Looking for a black needle. In a white room. With a giant magnet.
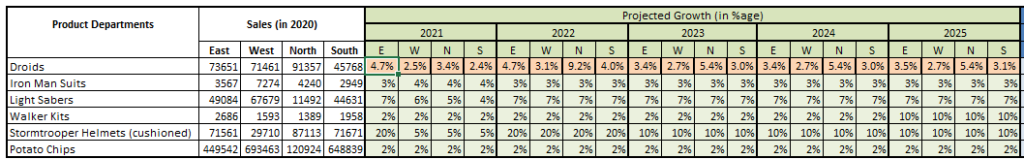
Hyperbole aside, after you list down all the inputs you need for modeling, talk to stakeholders and see if the data is even captured. If possible, get a sample data-set beforehand. If the data is not available, you have two options ahead of you - make some reasonable assumptions or select suitable proxies that can be used as an input. For e.g. in our previous warehousing model (view post, model), let us assume that Droids department fails to give their future forecast. Without growth numbers, the model simply can’t work. Hence, we have to search for an appropriate proxy.
![]()
One such proxy can be organizational growth. We can take the average of other departments and use that to plug into Droids growth numbers.
But this is obviously a workaround and should be used with caution. If the confidence of the stakeholders is low for using certain numbers, consider adding sensitivity analysis to it.
13.b Data completeness and Data accuracy
What is worse than having no data? Think, think.
No?
Having incomplete or inaccurate data.
This might be counter-intuitive but it becomes clear when you think about it. If you don’t have the data you know that you don’t have the data. You can find some workaround, search for other data sources or try to plug the gap by hook or crook.
BUT if you have incomplete or incorrect data, there is a good chance that you won’t even know that there is something amiss. And you’ll continue to merrily use the data to churn out wrong outputs.
This SCD found this out the hard way. In one of the consulting projects, we found that output didn’t make much sense to high-level client stakeholders. They thought that there was a logical problem with our model while we couldn’t find any error with it. After couple of days were lost in stand-off, the issue turned out to be with the raw data. The data extraction query that one of the analysts had run, had stopped in between having extracted only about 80% of the transactions. No one realized the incompleteness of the data till it was very late.
Fortunately, there is a very straightforward way to mitigate against such disasters– Data Playback.
Whenever you get any kind of large-scale data, before immersing yourself with modeling it, summarize it in a way that can be easily recognizable by the relevant stakeholders. When you play their data back to them, they will instantly tell you if the data is incomplete or inaccurate. And your conversation during the play-back will go something like this:
SCD: So as you can see in the table above, we have summarized the sales data provided by your IT team. Does it look alright to you?
Stakeholder1: Well, everything else looks more or less fine but I don’t think we sold $xxx worth of lightsabers in the south.
Stakeholder2: I agree, I remember not meeting my target in that month. But wait, have you considered the product returns in your data. We had some quality issues in our south factory and had to do a mass recall of multiple batches of lightsabers.
SCD: Aha! I think that must be the reason behind mismatch of numbers. If we can get the returns data, I’ll use that to net-off the sales. In fact, it’d make much more sense to use the net sales instead of gross ones.
Stakeholder 1: Makes sense. I’ll get one of my guys to send that data to you.
SCD: Cool! And we’ll use the net figures in the model. Glad that we caught this early on. Imagine having this conversation after modeling and with the Dark Lord himself!
Concluding Remarks
Did you find these tips useful? I know there are tons of others out there and we may write another post to expand more on these. Meanwhile, do let us know your thoughts in comments below or feel free to write to us.