All you supply chai n zombies (SCZs), who are now vying for the blood of the crackpot who wrote such a blasphemy as the title of this post, take a deep breath, cool down a bit and think back at the time when you last implemented the EOQ formula in its basic form. That is – NEVER.
Hmmm...and now that you are thinking about it, doesn’t it seem strange that one of the most popular supply chain concepts and most widely recognized formula that is literally taught on the first day of supply chain classes in college, is rarely used in the real world?
Well, there is a solid reason behind it. Rather, reasons behind how the real world considerations make our basic EOQ formula difficult to use in practical situations.
And you can too traverse this journey from Supply Chain Zombie to the supply chain detectives by understanding these factors and then tweaking the formulas to make it more suitable for your organization’s context.
But before you scram to your boss to make him salivate with your $545 million formula and start planning o spend that six figure bonus that he’ll shower on you, lets first clear up our basics about EOQ.
For the seasoned Supply Chain Detectives, who understand the basics of EOQ inside out – feel free to skip to the second part of this article. For the rest of us lesser mortals– read on.
The Basic EOQ Formula
While your soporific professor mumbled something about carrying costs and ordering costs in Supply Chain 101 you dozed off while doodling aliens and space rockets in your notebook. Well, don’t worry, we’ve got you covered.
EOQ stands for Economic Order Quantity. Well, what does it mean?
Everyday billions of individuals and millions of organizations across the globe buy stuff. For individuals, it varies from buying eggs, bread & butter to 8 iPhones for a Dog. And for organizations, it varies from manufacturing raw materials to office supplies, and from toilet papers to million dollar office decorations.
But, unless you are a billionaire owner of that Apple Watch brandishing dog, those billions of individuals and millions of organization must decide on one crucial factor while buying stuff – How much?
It may be intuitive for us to make the decision of ‘how much’ in some simple situations. E.g. eggs – On one hand you don’t want to buy too few eggs to save you trips to the grocery store everyday, one the other hand you also don’t want to buy too many to risk rotting them. And by using this rationale you settle on something in between say 1 week’s worth of supply.
What you are essentially doing here is trying to find a balance between two opposite cost elements – cost of visiting the grocery store too frequently vs cost of overstocking it.
This is what EOQ tells you. It finds the right balance between the Ordering Cost (cost of placing one order. In our example cost of visiting the grocery store once) and Carrying Cost (cost of carrying the inventory – storage costs, cost of capital etc.) mathematically and tells you exactly how much to buy.
Essentially what you are trying to minimize is the total cost of owning something.
Total Cost = Ordering Cost + Carrying Cost --- (1)
Let us look at both the components theoretically. Later in this article, we elaborate what actually constitutes ordering and carrying costs from the organization perspective. For now, we’ll stick to formulas.
Ordering Cost
Ordering Cost = Number of orders per year x Cost per order (K)
Number of orders per year = Annual demand (D) / Ordering Quantity (Q)
![]()
Carrying Cost
Carrying Cost = Average Inventory (in $) over the year x Inventory Carrying Costs (h)
Average Inventory (in units) = (Q/2)
Average Inventory (in dollar) = (Q/2) x c
[Because we are ordering Q units at a time and it uniformly depletes to zero as the inventory is consumed. Hence, the average inventory is (Q+0)/2]
Carrying Cost = ( Q/2) x c x h
Let’s put back these numbers in total cost equation (1)
Total Cost (TC) = [( D/Q) x K] + [(Q/2) x c x h]
Now do you see why we need to find a sweet-spot of ordering quantity to minimize total costs? No?
Alright, pay close attention to the Q in the above equation. In the first term Q is in the denominator. So when the ordering quantity Q decreases, the first term, Ordering Cost increases. Obviously.
However, in the second term, ordering quantity Q is in the numerator. So when Q decreases, the second term, carrying cost decreases. Obviously.
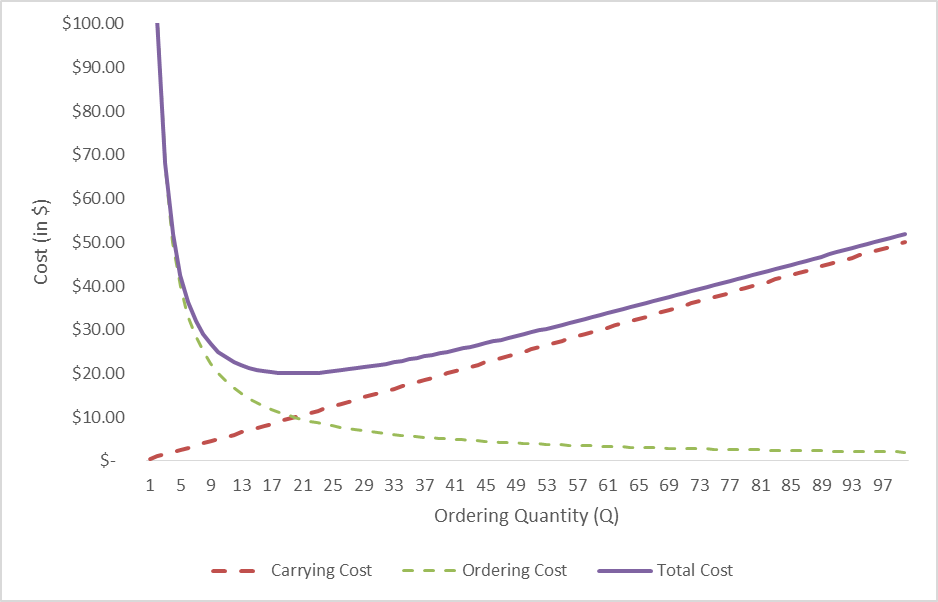
It is more obvious visually. Below, we have plotted the total cost for various ordering quantities (on the X- axis) and Total cost on Y-axis.

Download the workbook here.
As you can see Total Cost (TC), the purple line, first decreases and then increases with changing Q. Though it is hard to see but the minimum Total Cost occurs at around ordering quantity of 20 units.
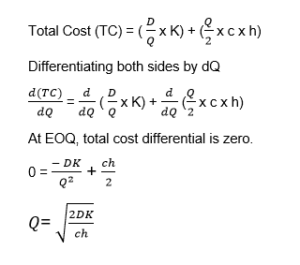
Using equation 3 we can derive (see footnotes for a detailed derivation) the order quantity for which the total cost is minimum. Voila! This order quantity is called Economic Order Quantity or EOQ.

We can also put the relevant data that was used to create the graphs above:
D= 100 units per annum, K = $ 2 per order, c = $ 5 per unit and h= 20%
And Q= 20 units that confirms our graph. Hence, we should order 20 units at a time.
This also means that we’ll place 5 orders per year and our average inventory will be 10 units.
Theory is fine but...
Now that you have a solid understanding of the basic EOQ formula, the trick to using it – even the basic version – depends on understanding those variables in the corporate context.
Product Cost (c) : This is the most straightforward variable to find out. Do keep in mind though that we need product’s landed cost and not the price.
Annual Demand (D): Another easy one. Just head down to your forecasting department and ask them politely to give you the projections for the next year. In all probability, they’ll throw a dart at the dart board and give a number to you. If they don’t – come back to your desk and prepare a forecast yourself by using some simple algorithms. That’s another post for another day.
Inventory Carrying Cost (h): Ah! Now we enter into exciting and tricky stuff. The basic premise of inventory carrying cost is any cost that is associated with holding extra inventory on our books. This typically includes cost of capital, cost of holding in warehouse (storage, insurance etc.)
However, this is not an exhaustive list – we should incorporate any other cost or risk that is associated with holding that extra inventory. E.g. risk of obsolescence, risk of damages etc.
Typically inventory carrying costs are taken to be around 17%. But remember, higher cost of capital, increasing risk and dynamic business environment (e.g. risk of design changes frequently) push this number up.
We’ll talk more about these in the next part of this article.
Ordering Cost: How much your organization spends on placing one order. It sounds simple but it is somewhat tricky to calculate. We should only add those ordering cost components that are variable in nature. That is, those costs components that are incurred every time there is an order.
Cost of stationery – ordering cost
Cost of courier – ordering cost
Inspection costs at inbound – ordering cost
Salary of the ordering manager – not an ordering cost
The last one is not an ordering cost because it doesn’t change with the number of orders placed and hence doesn’t impact our EOQ. In a strict sense however, this cost is a step function. Let’s say that up to a certain number of orders 1 ordering manager can handle the work. But for a large increase in orders, you may have to hire more people.
Well, now that we have a proper handle on the basic EOQ formula, we are now ready to take on the real world. But wait! Didn’t we say in the beginning that real world can put a spanner in using this formula in the basic form?
Well, that’s what the next part of this article deals with. Now that you are thorough with the basics , get your Cuban cigars out and get ready to become a true Supply Chain Detective.
Continue to Part 2
1 EOQ Derivation

